How to Audit Your Design System for Drift in One Afternoon
A design system audit doesn't need a quarter. Four hours, five components and one sheet give you a dated list of drift, ranked by what users feel.
Most design system audits never finish, because they are scoped like a migration. Every component, every screen, a spreadsheet with 400 rows. By the time it is done, the product has moved on and the findings are out of date.
This one fits in an afternoon. Four hours, five components, one sheet. You end with a dated list of the places where your design and your code disagree, ranked by what your users actually feel. A row on that list reads like this: Button, focus state designed in Figma, never rendered in code, since March.
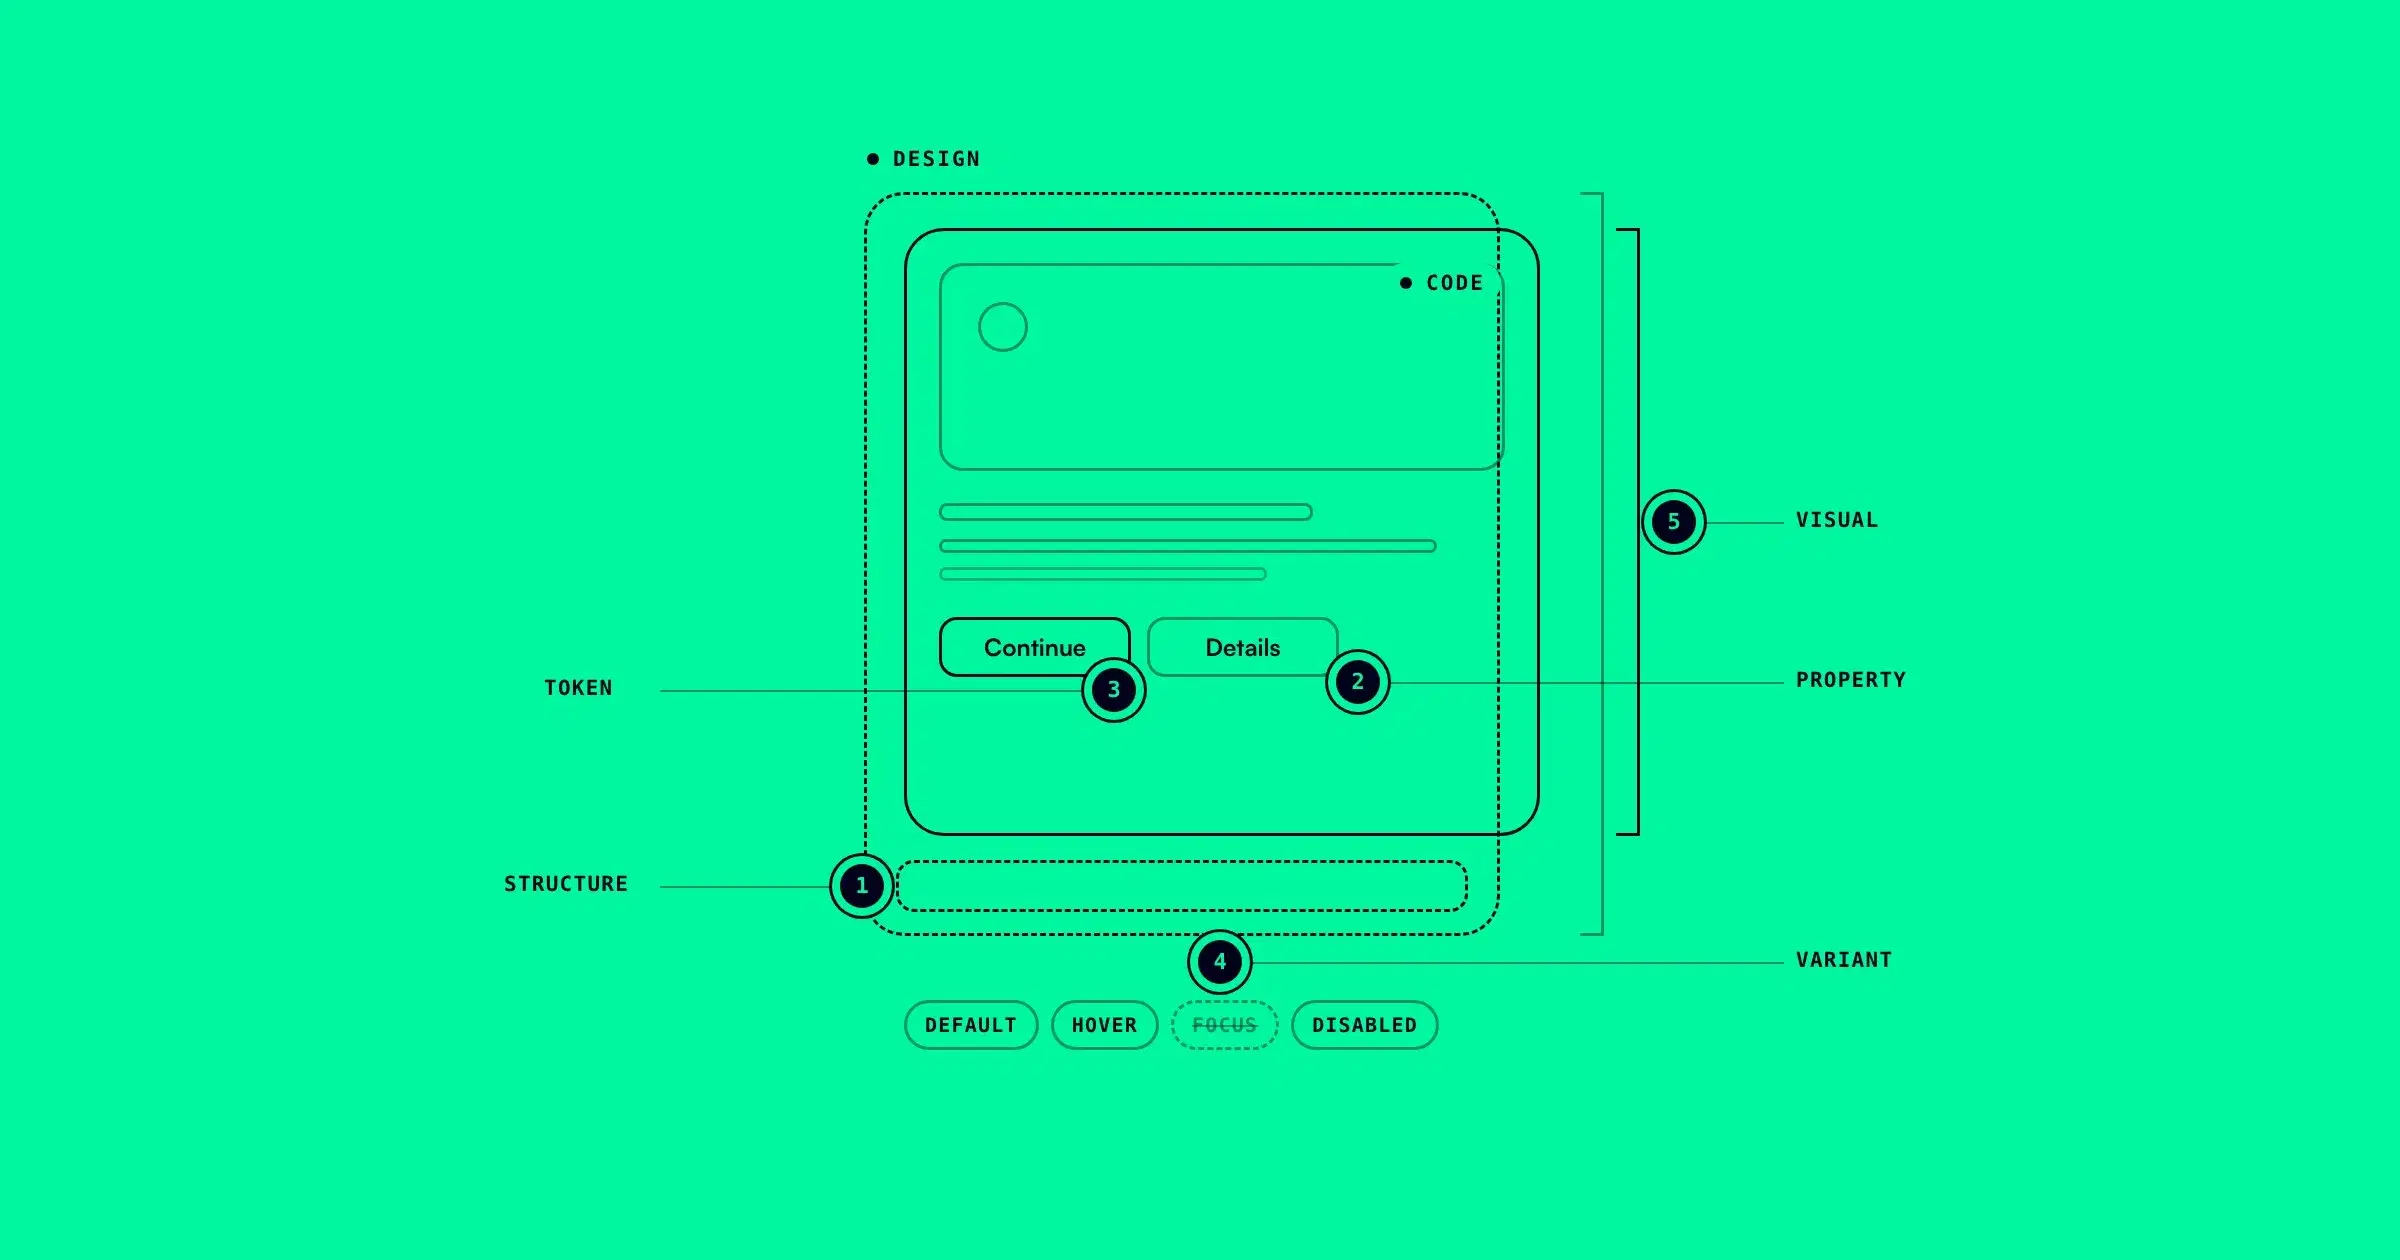
It uses the five types of drift: structure, properties, tokens, variants and visuals. If those are new to you, the five types of design system drift defines each one and how to detect it. This post is the schedule that puts them to work.
Before you start (10 minutes)
You need four things open: the Figma file that holds your component library, the repository, Storybook if your team has one, and a browser with developer tools.
Block four hours with no meetings. If you can, do it as a pair: one person who knows the Figma library and one who knows the code. An audit is a comparison, and it goes twice as fast when both sides are in the room.
Copy the sheet from hour 3 into whatever your team already uses. A shared doc is fine. The sheet is the deliverable, so start it now.
Hour 1: Pick the five components that matter
Do not audit everything. Pick by reach.
Count how often each component is imported. This ranks every component in src by how many files import it:
grep -rhoE "from ['\"][^'\"]*components/[A-Za-z]+" src | sed -E 's#.*/##' | sort | uniq -c | sort -rn | head -20The pattern assumes import paths that contain components/Name. If your team imports everything from one barrel file (from '@/components'), count a single component by name instead:
grep -rlw "Button" src | wc -lThen choose five:
- The top three by imports. Drift in these spreads to every screen they touch.
- One component on your most important flow, like checkout or sign-up, even if it is used less.
- One component that changed recently in Figma. Open the library's version history and look at the last month. Recent design changes are where code most often lags.
Write the five names at the top of the sheet. Button, Text Input, Card, Modal and Select is a typical first set.
Hour 2: Inventory both sides
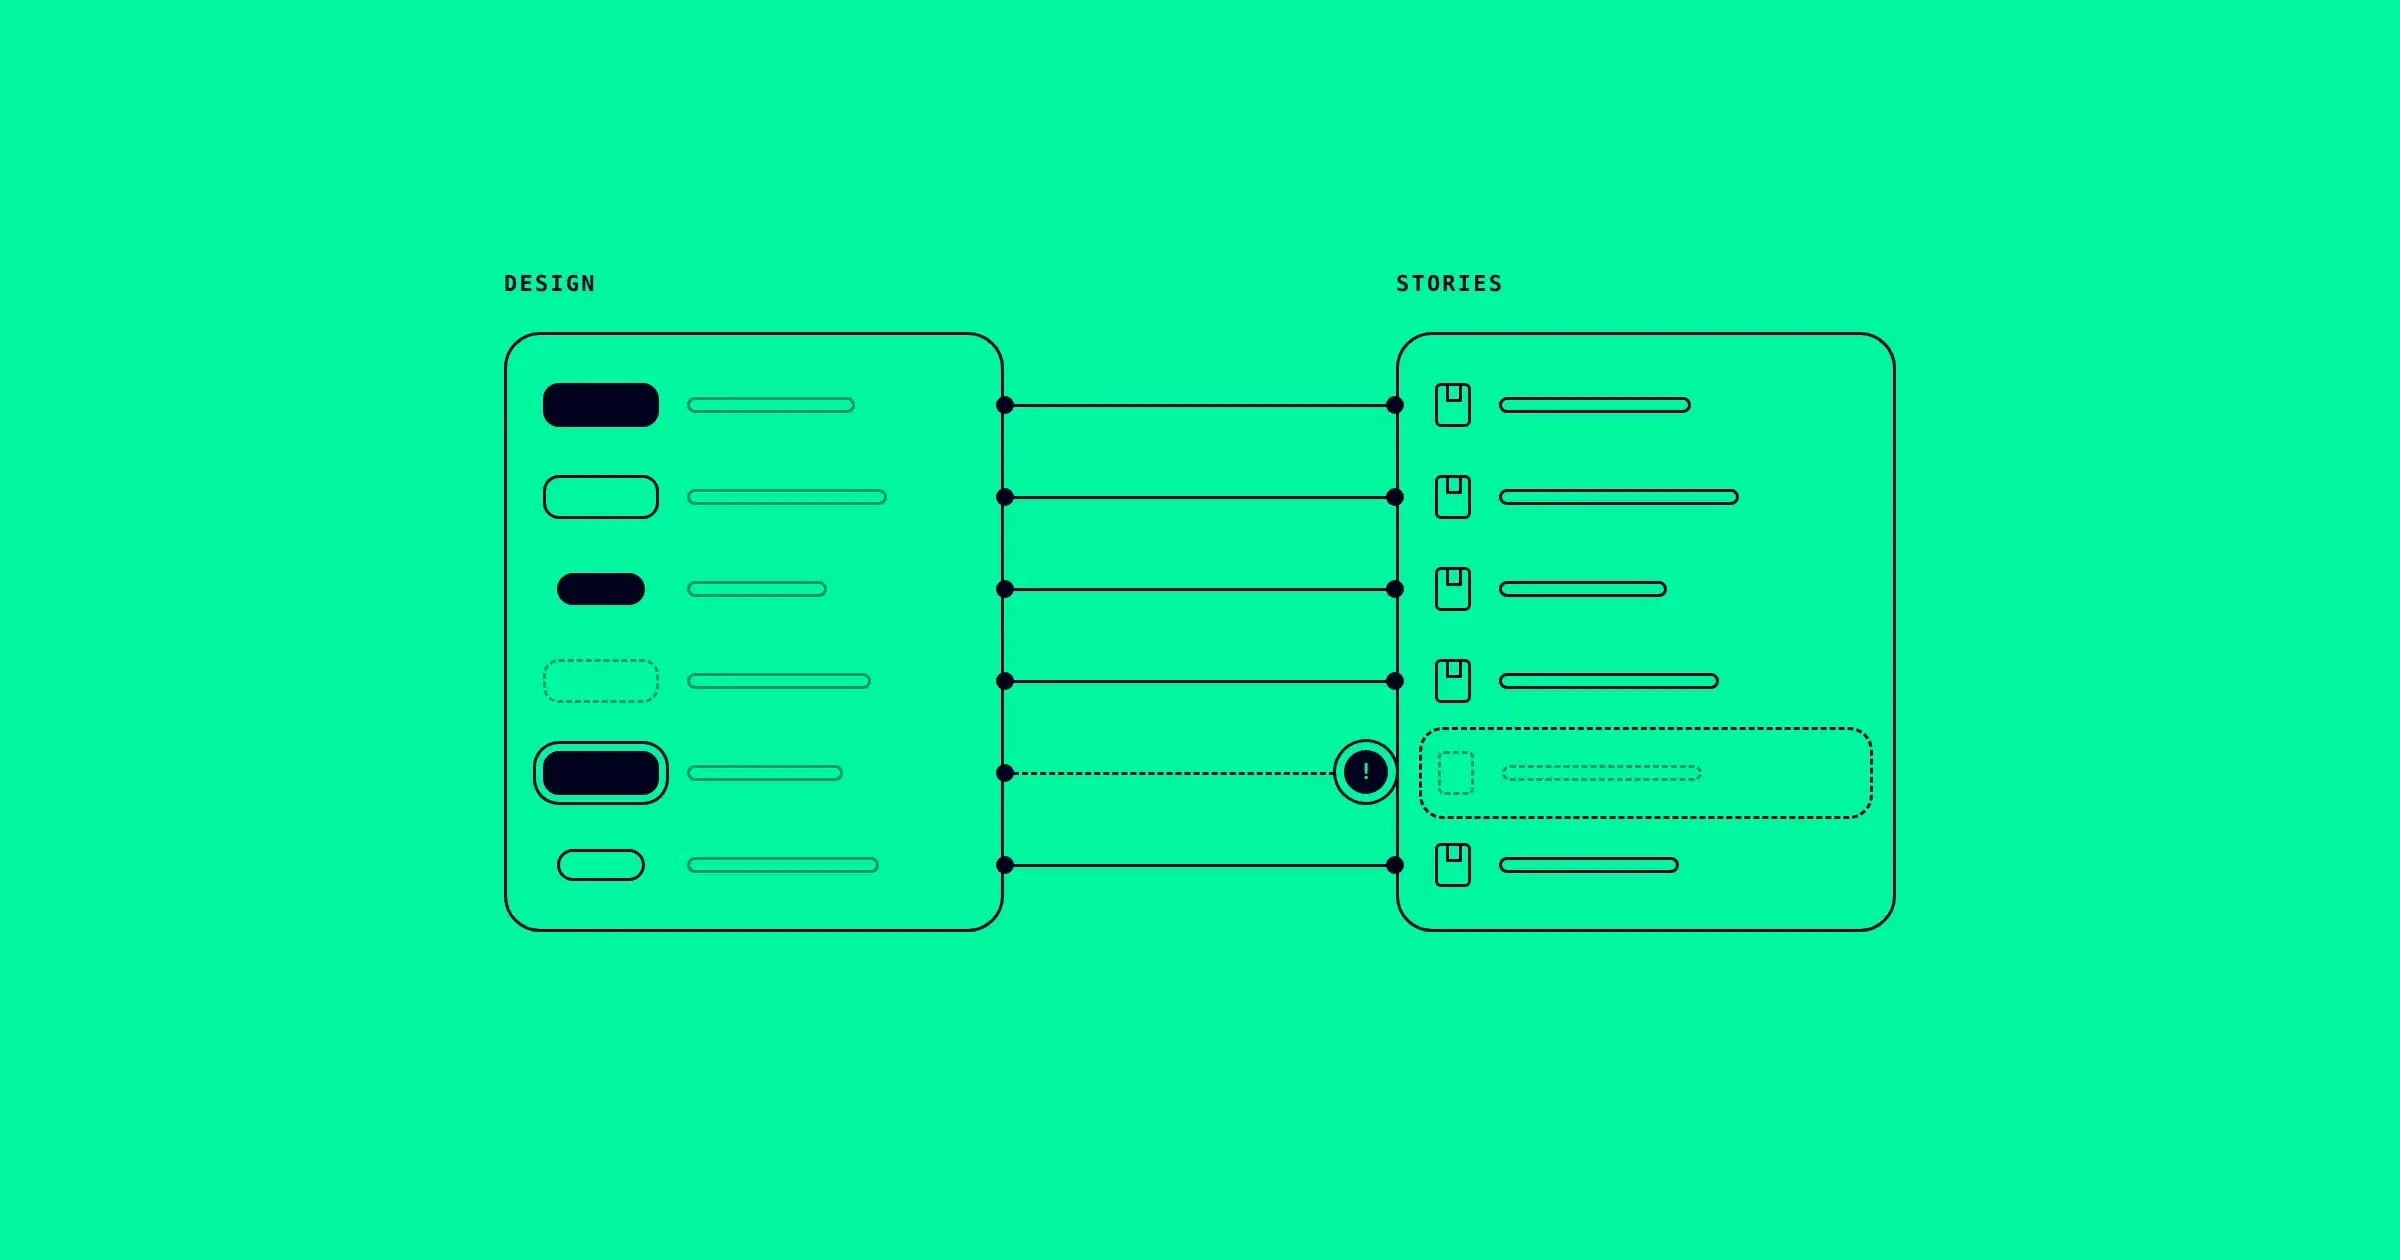
For each component, write down two lists side by side: what the design defines, and what the code renders.
The design side. Open the component set in Figma and list its properties and their values. A Button might have Type (Primary, Secondary, Ghost), Size (Small, Medium) and State (Default, Hover, Focus, Disabled). Multiply them out: that is the number of variants the design promises.
The code side. Open the component's file and list its props. Then open its stories. In Storybook's standard format, every named export in a stories file is one story, so this counts them:
grep -c "^export const" src/components/Button/Button.stories.tsxAdjust the path to your repository. If your team has no Storybook, the code side is the component's props and the places it renders in the product.
Write both numbers in the sheet. The gap between them is your first finding. If the design defines 16 variants and Storybook shows 5, then 11 of them have never been rendered next to their design. Some will be fine. One of them is usually a focus state.
Hour 3: Compare, one row per difference
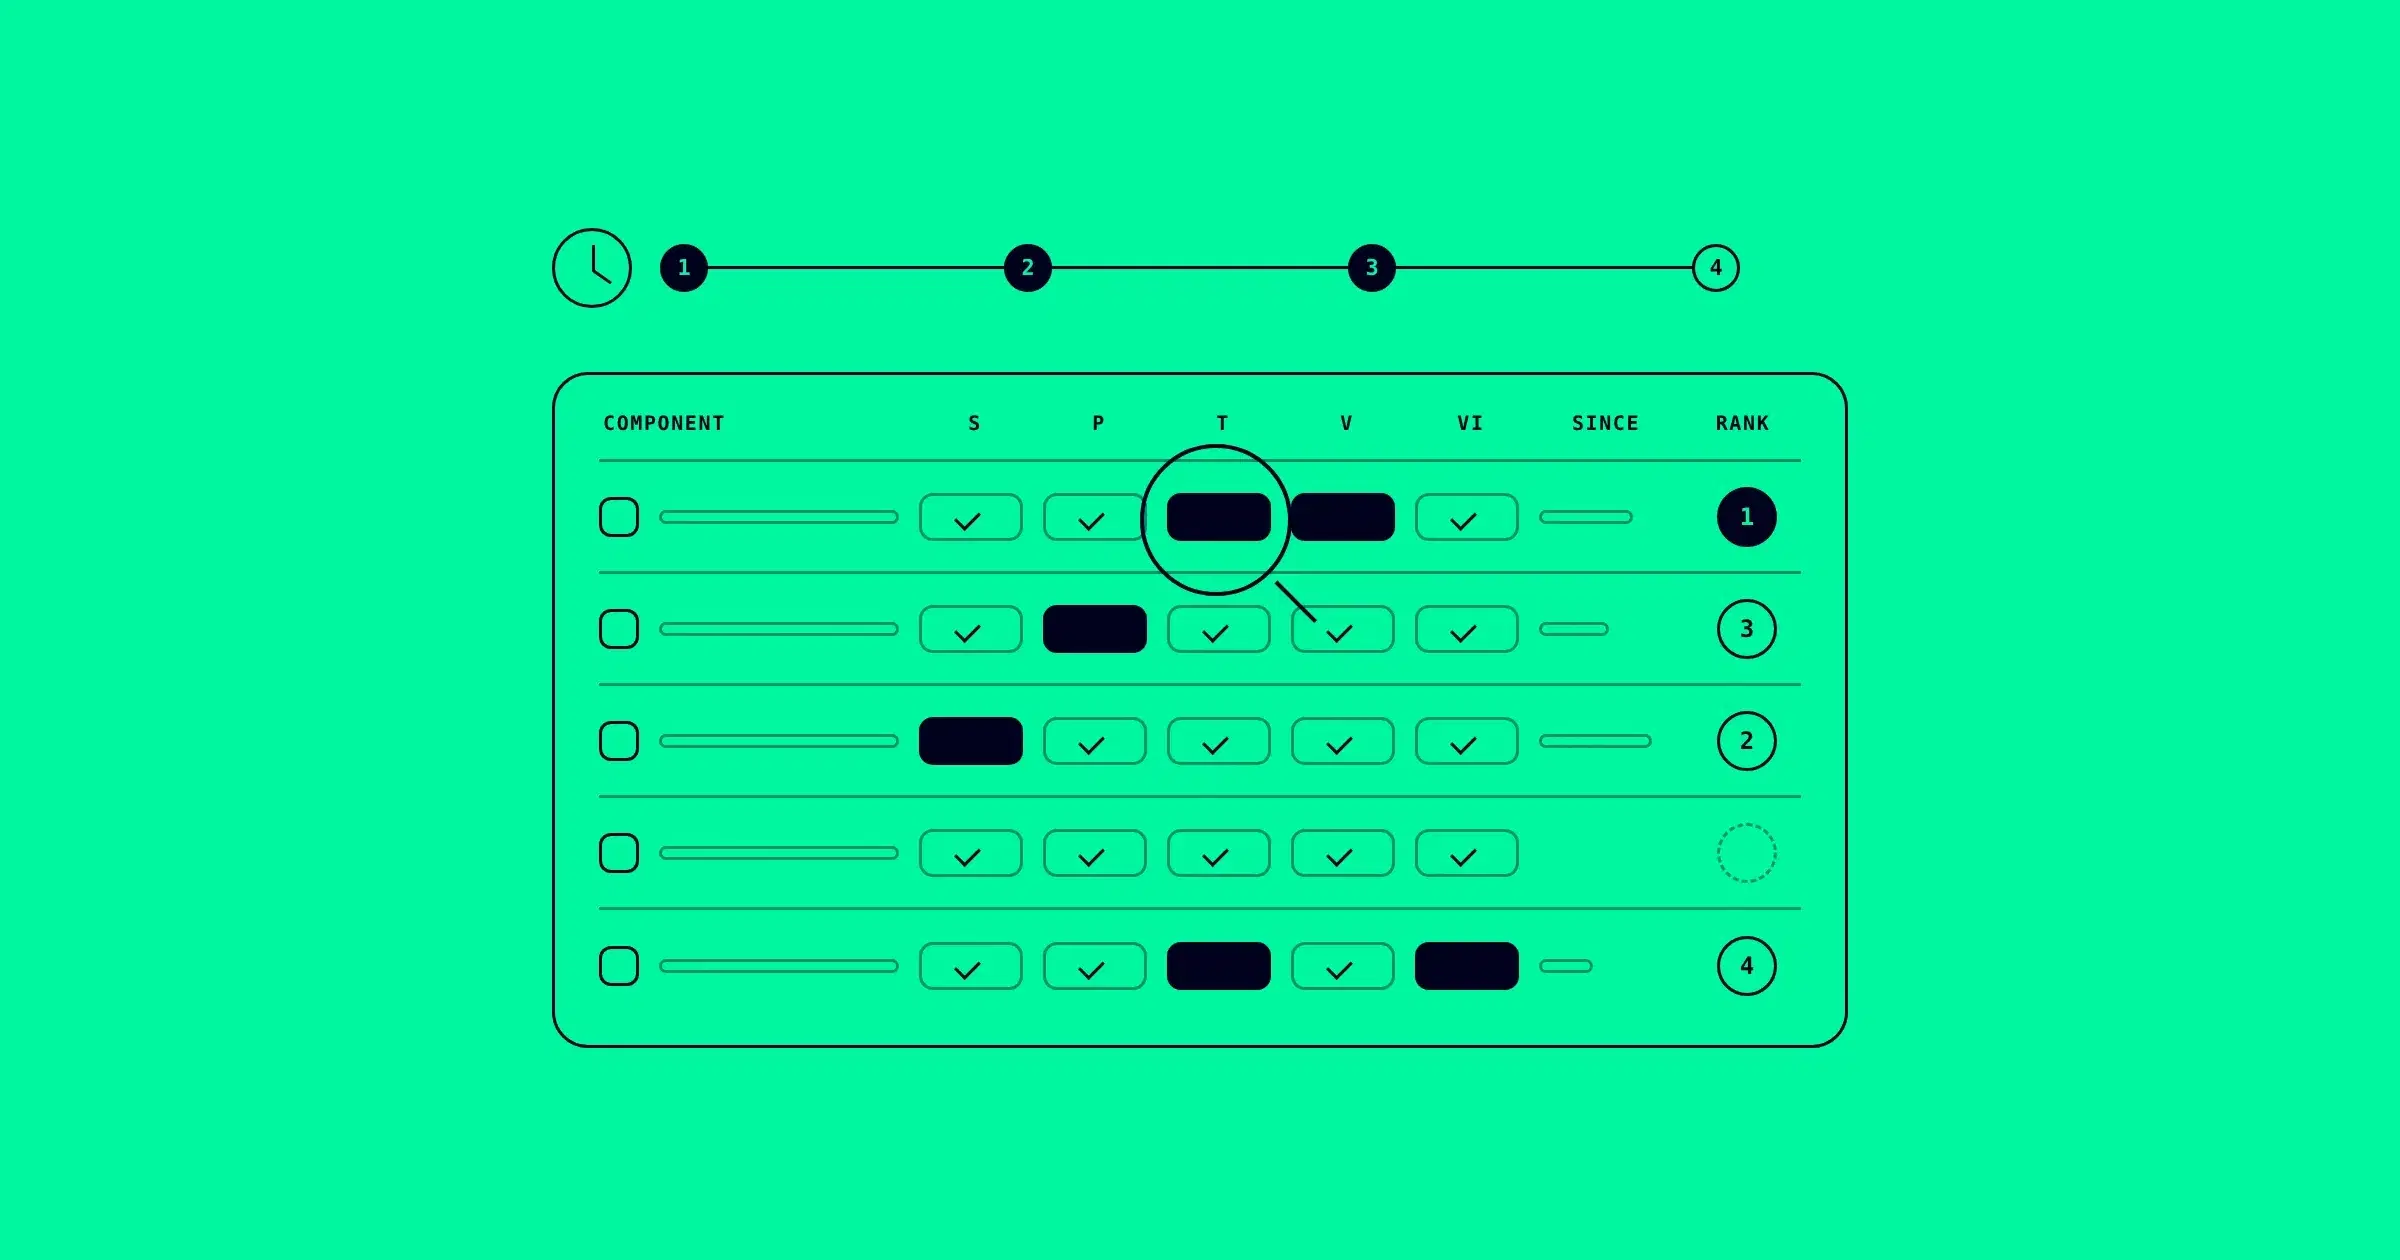
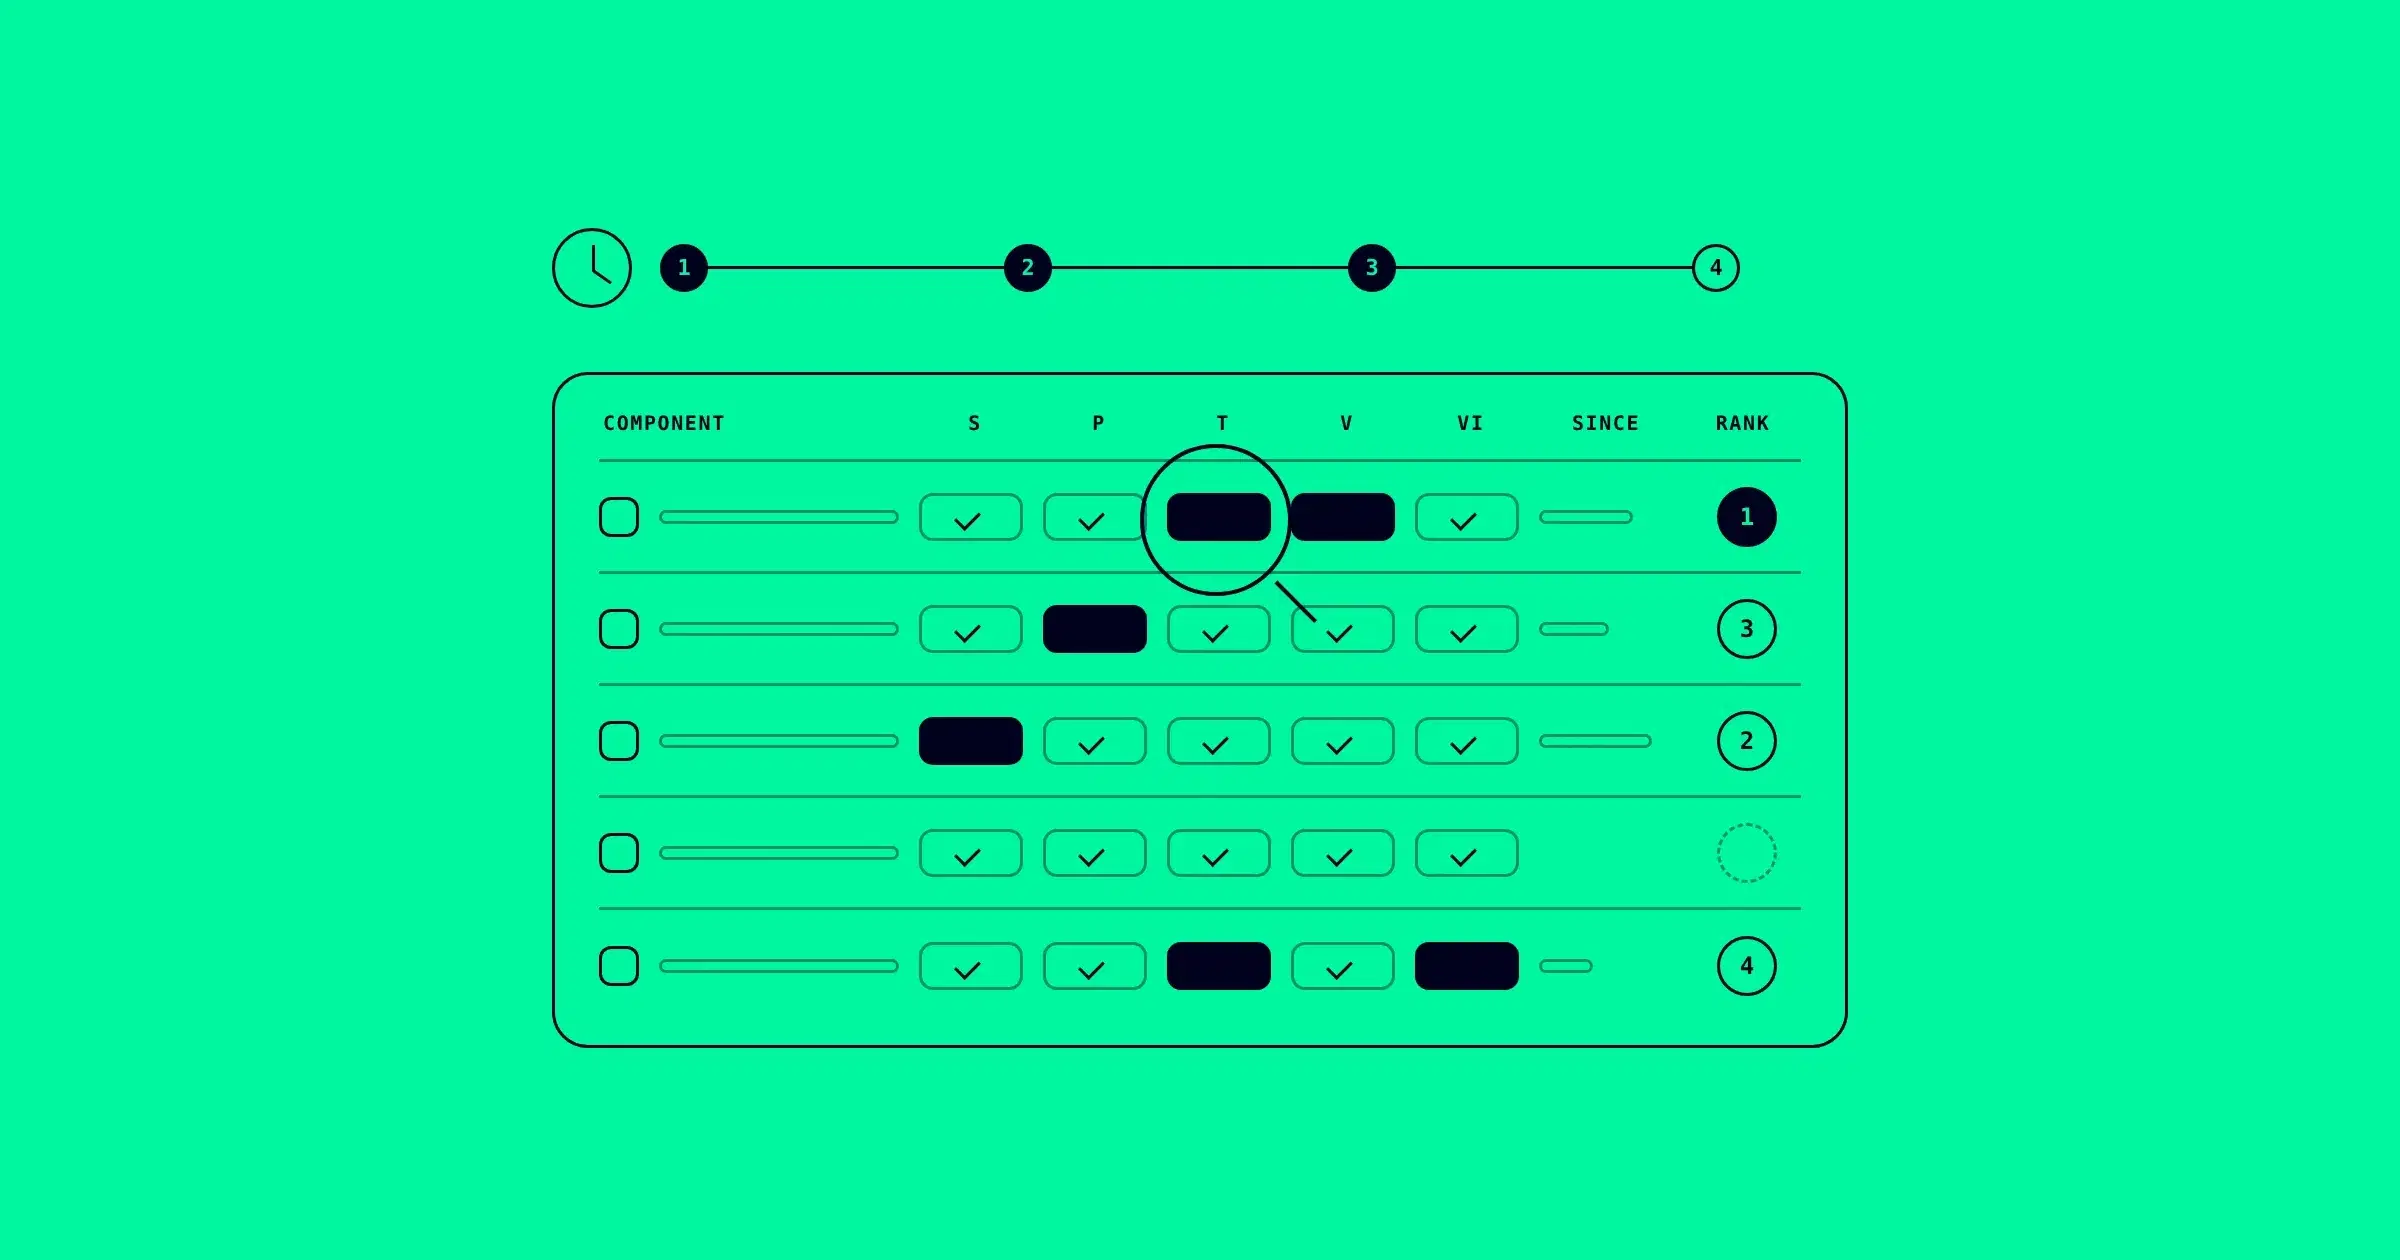
This is the sheet. One row per difference, values on both sides, no adjectives.
| Component | Type | Design | Code | Since | Who feels it | Rank |
|---|---|---|---|---|---|---|
| Button | Token | color/primary #632ff7 | #7a4dff, hardcoded in 3 places | Everyone on checkout and pricing | ||
| Button | Variant | State=Focus designed | No story, no focus ring | Keyboard users | ||
| Button | Property | Size=Small is 44px tall | Renders 36px | Mobile users | ||
| Card | Structure | Footer slot for actions | No footer in code | Anyone comparing two plans |
The rows above are illustrative. Yours will have your own values.
Work through the five types for each component. One line of method each; the anchor post has the detail:
-
Structure. Compare the Figma layer tree with the rendered elements in your browser's Elements panel. Look for a slot, an icon or a wrapper that exists on one side only.
-
Properties. Compare the Figma properties from hour 2 with the props in code. A property with no matching prop, or a prop the design never mentions, is a row.
-
Tokens. Select the element in developer tools and read the real value in the console.
$0is the element you selected:JavaScriptgetComputedStyle($0).backgroundColorThen search the code for the old value, to find where it is still hardcoded:
Shellgrep -rn "#7a4dff" src -
Variants. Compare the variant list from hour 2 with the stories. Every design variant without a story is a row.
-
Visuals. Put the design frame and the rendered story side by side, at the same zoom, and look for what does not match: height, spacing, alignment.
Five components times five types is 25 checks in an hour, so about two minutes each. Most checks will match. Write "match" in the sheet when they do: knowing what is aligned is a finding too, and it tells you where not to look next time.
The one rule for this hour: values, not impressions. "Looks a bit off" is not a row. "44px in design, 36px in code" is.
Hour 4: Date it and rank it
A difference without a date is a guess about how bad it is. A difference with a date is a fact.
Date the code side. git log -S lists every commit that added or removed a string. Search for the value that drifted:
git log -S "#7a4dff" --oneline -- src/The oldest commit is at the bottom. That is roughly when this drift started.
Date the design side. In Figma, open the library's version history and find when the design value last changed. If the design changed in June and the code still has the old value, the drift is as old as the June change.
Write the date in the Since column. Then rank every row by what it costs users, not by how big the difference looks:
- Rank 1: it blocks a group of users or breaks a core flow. A missing focus state, a tap target below 44px, a primary action on checkout that no longer looks like one.
- Rank 2: it is visible across many screens. The brand color in two shades, spacing that changes from page to page.
- Rank 3: cosmetic and contained. A 1px offset in one place.
Inside each rank, older goes first. A focus state missing since spring outranks a spacing difference from last week.
Sort the sheet. Your top three rows become tickets, written the same way as the rows: the component, both values, the date. "Button focus ring: designed in Figma, not rendered in code, since March." No names in the ticket. Drift is not anyone's fault. It is what happens when nothing compares the two copies.
What one afternoon cannot tell you
This audit is a sample. Five components out of maybe sixty, checked by eye, on one day. It will find the drift that matters most right now, and that is worth the four hours.
It will not catch the small values a human misses when two images sit side by side. It will not cover every variant of every component. And it starts going out of date the moment the next pull request merges, because drift does not stop while you fix the first three rows.
That is the job continuous comparison does. deeepSpace compares every mapped component on all five types, variant by variant, rendered from your Storybook, and traces each difference to the commit it ran against. Run this afternoon by hand once, so you know what you are looking at. Then let design drift detection run it automatically.